mapmuts_enrichmentgeomeans.py
This script is designed to be used after you have inferred the enrichment ratios for several libraries using mapmuts_inferenrichment.py. This script then computes the geometric means of the enrichment ratios for each library, and then uses those geometric mean enrichment ratios to calculate equilibrium frequencies and site entropies.
Dependencies
This script requires matplotlib for plotting.
Background and nomenclature
The mapmuts_inferenrichment.py program calculates posterior mean enrichment ratios phi for mutations using MCMC, and stores them in *_enrichmentratios.txt files. If you have several library replicates, you might want to somehow average these enrichment ratios. In principle, you can run the MCMC over several libraries, but in practice this seems to lead to inflated enrichment ratios in cases where one library has a very large value of phi but the others do not.
A good way of getting an “average” enrichment ratio is therefore to take the geometric mean of the enrichment ratios for the individual libraries – that is what this script does. In general you would want to apply it to several replicates of identical libraries, although there is also an option (specified by the excludesite option) to use information from libraries only closely related mutants of a protein.
The output of this script is the geometric mean of the enrichment ratios, as well as site entropies and equilibrium frequencies (these concepts are described in more detail in the mapmuts_inferenrichment.py documentation) computed from these geometric mean enrichment ratios. Also see the following PDF file, which describes the net computations performed by mapmuts_inferenrichment.py and this script:
enrichment_inference_algorithm.pdf
Running the script
To run this script from the prompt, first create a text infile of the
format described below. Then simply type mapmuts_enrichmentgeomeans.py
followed by the infile name. For example, if the name is infile.txt,
type:
mapmuts_enrichmentgeomeans.py infile.txt
Input file
The input file is a text file with a series of key / value pairs. The required keys are indicated below. The values should not include spaces.
Lines beginning with # and empty lines are ignored.
Keys for the input file:
enrichmentratios : A listing of the enrichment ratio files generated as
*_enrichmentratios.txtby mapmuts_inferenrichment.py. You must list at least one file here, but can list more than one if you also want to look at correlations between pairs of samples. The files must exist, and the filenames cannot contain any spaces. To list multiple files, just separate them by spaces.excludesite_NNN : This is an optional key that does not have to appear at all. You would use this key if you want to exclude a particular site from just one of multiple libraries specified by enrichmentratios. For instance, imagine that key specify four files. Imagine that the first two and last two files differ in identity at residue 334, so that only two of the libraries (say the first two) would be used for the inference at this site. You would then set:
excludesite_334 use use exclude exclude
In this usage, the key excludesite_ has a suffix giving a site number. There then should be a number of entries equal to the number of files specified for enrichmentratios, etc. In order, put use if that file is used for that site and exclude if that file is excluded for that site. Note, however, that at least one file must be use for each site. If you don’t want to exclude any sites from particular libraries, then just don’t include this key. If you want to exclude more than one residue, then have multiple entries of the key.
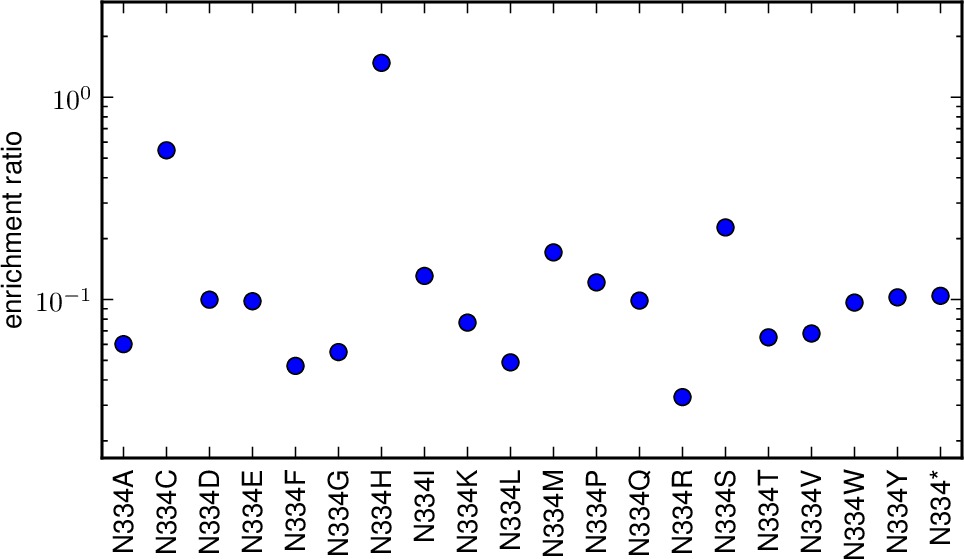
enrichmentratio_plots is the directory to which we write plots showing the enrichment ratios for all mutations at a site. This is the geometric mean of the various individual library enrichment ratios. If you set this to the string None, then no such plots are created. Otherwise, if matplotlib is available, then files with the prefix specified by outfileprefix and the suffix corresponding to the mutation (such as M1A.pdf or N334H.pdf) are created in the directory enrichmentratio_plots. Note that this directory must already exist; it is NOT created.
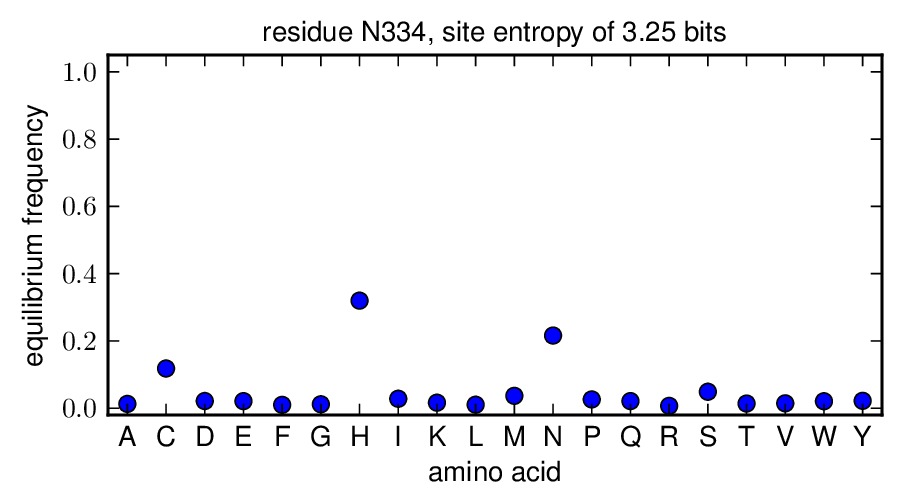
equilibriumfreqs_plots is the directory to which we write plots showing the equilibrium frequencies for all amino acids at a site. This is the equilibrium frequency calculated from the geometric means of the various individual library enrichment ratios. If you set this to the string None, then no such plots are created. Otherwise, if matplotlib is available, then files with the prefix specified by outfileprefix and the suffix corresponding to the residue (such as M1.pdf or N334.pdf) are created in the directory equilibriumfreqs_plots. Note that this directory must already exist; it is NOT created.
outfileprefix is a string giving the prefix for the output files as described below.
Example input file
Here is an example input file:
# Input file for mapmuts_enrichmentgeomeans.py
enrichmentratios WT-1/WT-1_enrichmentratios.txt WT-2/WT-2_enrichmentratios.txt N334H-1/N334H-1_enrichmentratios.txt N334H-2/N334H-2_enrichmentratios.txt
excludesite_334 use use exclude exclude
outfileprefix combined_geomean
enrichmentratio_plots enrichmentratio_plots/
equilibriumfreqs_plots equilibriumfreqs_plots/
Output
Output files are created with the prefix specified by outfileprefix. If any of these files already exist, they are overwritten. These files are:
outfileprefix_enrichmentratios.txt : a text file giving the geometric mean of the posterior mean of the inferred enrichment ratios for all libraries specified by enrichmentratios. The file has the following columns (separated by tabs):
- MUTATION : mutation name, such as M1A.
- GEOMEAN_PHI : the geometric mean of the inferred enrichment ratio posterior means fro all of the libraries specified by enrichmentratios.
Here is an example of a few lines:
#MUTATION GEOMEAN_PHI
M1A 0.171246
M1C 0.249930
M1D 0.249028
M1E 0.246096
M1F 0.245388
M1G 0.172780
M1H 0.234997
M1I 0.113813
M1K 0.255940
outfileprefix_equilibriumfreqs.txt : a text file giving the equilibrium frequencies for each amino acid at each site. Stop codons are NOT included as possible identities for these frequencies. The equilibrium frequency pi for an amino acid is calculated from the geometric mean enrichment ratio phi. Essentially, this gives the probability that an amino acid would have some identity if all residues were present at relative frequencies specified by the enrichment ratios. We also calculate a site entropy h for each site as the entropy (log base 2, units of bits) for a hypothetical situation in which each amino acid is present at its equilibrium frequency. All of this information is written to this text file. The first column gives the residue number, the second column gives the wildtype amino acid, the third column gives the site entropy, and the remaining columns give the equilibrium frequencies for all of the amino acids in the order indicated by the header (which is alphabetical order). Here is an example of a few lines:
#SITE WT_AA SITE_ENTROPY PI_A PI_C PI_D PI_E PI_F PI_G PI_H PI_I PI_K PI_L PI_M PI_N PI_P PI_Q PI_R PI_S PI_T PI_V PI_W PI_Y
1   M   4.063980    0.035380    0.051636    0.051450    0.050844    0.050698    0.035697    0.048551    0.023514    0.052878    0.029298    0.206602    0.052339    0.036233    0.049689    0.028100    0.026248    0.037069    0.026387    0.056218    0.051170
2   A   2.916478    0.493120    0.025100    0.025514    0.043860    0.029769    0.012059    0.012405    0.020354    0.026235    0.007163    0.118429    0.020809    0.003767    0.016877    0.006905    0.009597    0.011775    0.051123    0.041176    0.023962
3   S   3.368413    0.039375    0.010811    0.008294    0.012489    0.160579    0.007068    0.021544    0.014624    0.011574    0.253193    0.035198    0.014573    0.006610    0.017904    0.010872    0.154344    0.023793    0.013304    0.054196    0.129656
4   Q   3.206882    0.014669    0.010812    0.001101    0.007597    0.233611    0.007712    0.001347    0.104908    0.003885    0.207108    0.006095    0.126407    0.000240    0.016678    0.001580    0.088960    0.045545    0.011868    0.041575    0.068301
The plots showing the geometric mean enrichment ratio for each mutation at a site. These plots are are PDFs in the directory specified by enrichmentratio_plots. The plots have the prefix given by outfileprefix followed by an underscore and the residue wildtype identity and number, such as _M1.pdf.
- The plots showing the equilibrium frequencies for each amino acid at a site. These plots are are PDFs in the directory specified by equilibriumfreqs_plots. The plots have the prefix given by outfileprefix followed by an underscore and the residue wildtype identity and number, such as _M1.pdf. Here is an example of such a plot: