mapmuts_alignmentsummaryplot.py
Makes summary plot after several runs of mapmuts_makealignments.py.
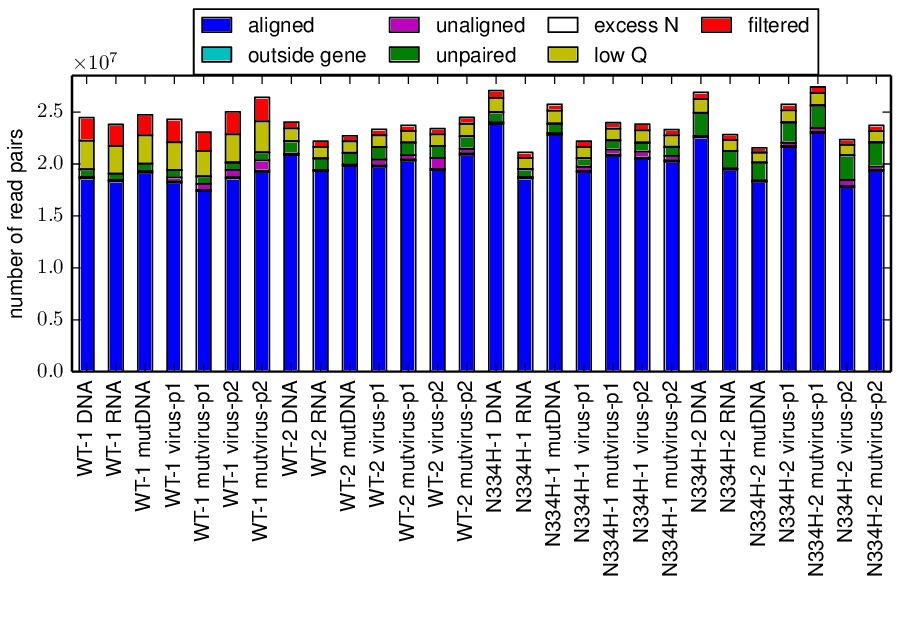
This script creates a stacked bar graph that summarizes the overall number of reads for each sample and how many reads were retained and removed during the alignment process.
To run this script from the prompt, first create a text infile of the
format described below. Then simply type mapmuts_alignmentsummaryplot.py
followed by the infile name. For example, if the name is infile.txt,
type:
mapmuts_alignmentsummaryplot.py infile.txt
This script is designed to be run after you have already run
mapmuts_makealignments.py on several samples. Each run of that program
generates an *_alignmentstatistics.txt file. This script reads in
those files and creates a stacked bar graph that summarizes the output
of the various samples.
This script will only work if pylab / matplotlib are available.
Input file format
The input file should specify all of the *_alignmentstatistics.txt files created by mapmuts_makealignments.py along with the sample names these are assigned. Each entry should be on a separate line, with the file name (no spaces allowed) followed by a space and then the sample name used in the plot (spaces are allowed). There must be at least two such entries.
There should then be a line with the initial word plotfile and then the name of the PDF plot that is created. This file is overwritten if it alread exits.
Blank lines and lines beginning with # are ignored.
Here is an example input file:
# Input file to mapmuts_alignmentsummaryplot.py
sample_1_alignmentstatistics.txt sample 1
sample_2_alignmentstatistics.txt sample 2
plotfile alignmentstatistics_plot.pdf
Output of script
The result of this script is the creation of the output PDF file specified by plotfile. Here is an example of such a plot: