phyloExpCM_SiteLikelihoodComparison.py
This simple script is designed to compare per-site likelihoods computed with two different substitution models. This is useful if you would like to determine which sites (or types of sites) are described better by one model versus another.
Typically, the per-site likelihoods are listed in files such as those created by running the phyloExpCM scripts phyloExpCM_ExpModelOptimizeHyphyTree.py or phyloExpCM_optimizeHyphyTree.py with the persitelikelihoods option.
You can optionally compare the per-site likelihood performance to site classifications based on relative solvent accessibility (RSA) or secondary structure computed using DSSP. This will require you to have a crystal structure for your protein that you can analyze with DSSP.
This script requires mapmuts and matplotlib.
To run the script, create an input file of the format described below. Then run the script followed by the input file, as in:
phyloExpCM_SiteLikelihoodComparison.py infile.txt
Format of the input file
The input file specifies key / value pairs on individual lines in the format:
key1 value1
key2 value2
Blank lines or lines that begin with # are ignored (i.e. as comment lines).
The input file should contain the following keys:
sitelikelihoodfiles : This key should be followed by the names of two existing files listing the per-site likelihoods for all sites in the gene. The names of the files cannot contain spaces. The must list exactly the same sites. Typically, these are the files created with the persitelikelihoods option of phyloExpCM_ExpModelOptimizeHyphyTree.py or phyloExpCM_optimizeHyphyTree.py. Here is an example of the format (the first line is a header, all other lines list sites and then likelihoods):
#SITE   SITE_LOG_LIKELIHOODS
1   -4.792906363107919
2   -15.89808216031635
3   -17.19022748421175
modelnames : This should be the names of the two models using to produce the two files specified by sitelikelihoodsfiles. These names cannot contain spaces, but they can contain underscores which are converted to spaces in the displayed results.
outfileprefix : The prefix of the output files created by this script (see Output files). Set to None if you don’t want any prefix and just want the base names described in Output files.
dsspfile : is an option that allows you to compare the observed site entropies and preferences to the relative solvent accessibility (RSA) and the secondary structure for the sites. This will only be useful if a crystal structure for your protein is available. You can then use the DSSP webserver to calculate the secondary structures and the RSAs. If you do not want to use this option, just set dsspfile to None. If you do want to use this option, then run DSSP on your protein structure – this script is tested against output from the DSSP webserver, but should probably work on output from the standalone too. Then save the DSSP output in a text file, and specify the path to that file as the value for dsspfile. This script does not currently have a robust ability to parse the DSSP output, so you have to do some careful checks. In particular, you must make sure that residue numbers in the PDB file exactly match the residue numbering scheme used for the rest of this analysis (i.e. the same residue numbers found in sitepreferences, and that none of the residue numbers contain letter suffixes (such as 24A) as is sometimes the case in PDB files. It is not necessary that all of the residues be present in the PDB. If there are multiple PDB chains, you can specify them using the dsspchain option. DSSP only calculates absolute accessible surface areas (ASAs); the RSAs are computed by normalizing by the maximum ASAs given by Tien et al, 2013.
dsspchain : is an option that is only meaningful if dsspfile is set to a value other than None. In this case, it should specify the chain in the PDB file that we want to use. If there is only one chain, you can set this option to None.
Example input file
Here is an example input file:
# input file for running script phyloExpCM_SiteLikelihoodComparison.py for phyloExpCM_SiteLikelihoodComparison
sitelikelihoodfiles codonmodel_optimized_trees/Tree-GY94_Model-fitbetaHalpernBruno/sitelikelihoods.txt codonmodel_optimized_trees/Tree-GY94_Model-GY94_CF3x4_omega-global-gamma4_rates-gamma4/sitelikelihoods.txt
modelnames experimental GY94
dsspfile 1XPB_renumbered.dssp
dsspchain None
outfileprefix None
Output files
The output of this script is two PDF plots and a text file. These files give the site likelihood computed by model 1 (the first entry in sitelikelihoodsfiles and modelnames) minus the site likelihood computed by model 2 (the second entry in sitelikelhoodsfiles and modelnames).
These files all have the prefix specified by outfileprefix followed by the following to suffixes:
sitelikelihoodcomparison_bySS.pdf: sites are categorized according to secondary structure in this PDF plot.
sitelikelihoodcomparison_byRSA.pdf: sites are categorized according to RSA (relative solvent accessibility) in this PDF plot.
sitelikelihoods.txt: text file listing per-site likelihoods and differences between them for the two models. These are sorted according to the differences in site likelihoods. Here are the first few lines of such a file:#SITE experimental_likelihood_minus_GY94_likelihood experimental_likelihood GY9 4_likelihood secondary_structure relative_solvent_accessibility 33 -17.8153 -94.7358 -76.9205 helix $< 0.33$ 236 -16.6144 -77.372 -60.7576 loop $< 0.33$ 102 -15.1698 -75.4882 -60.3184 loop $0.33 - 0.67$ 162 -12.0474 -102.512 -90.4646 loop $< 0.33$ 237 -10.3165 -87.4672 -77.1507 loop $0.33 - 0.67$
Here are examples of the two plots. The y-axis labels show the site category (top line of label) and the number of sites that fall into that category (bottom line of label).
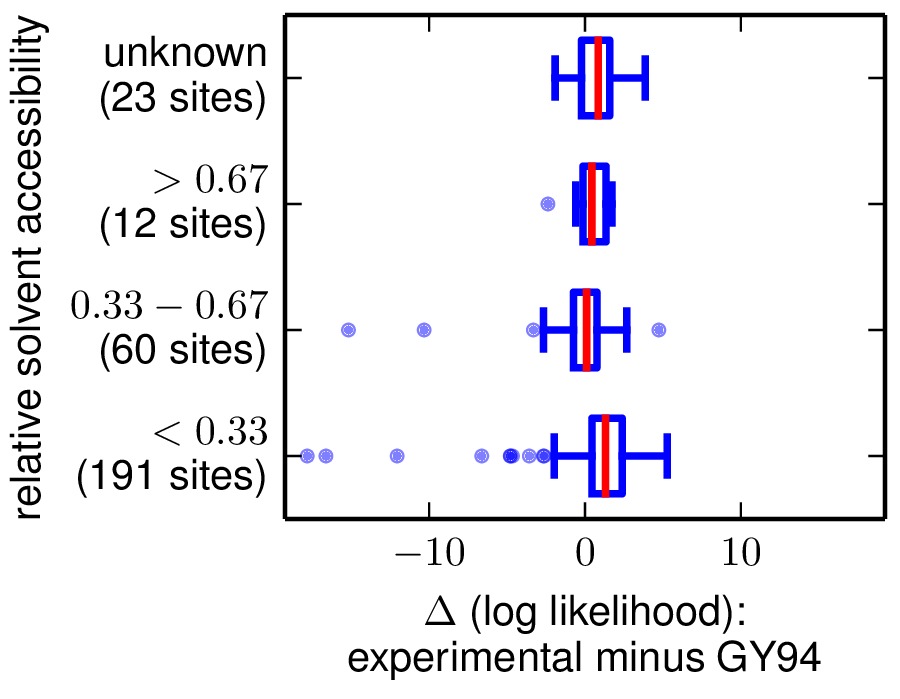
Example of the sitelikelihoodcomparison_byRSA.pdf plot.
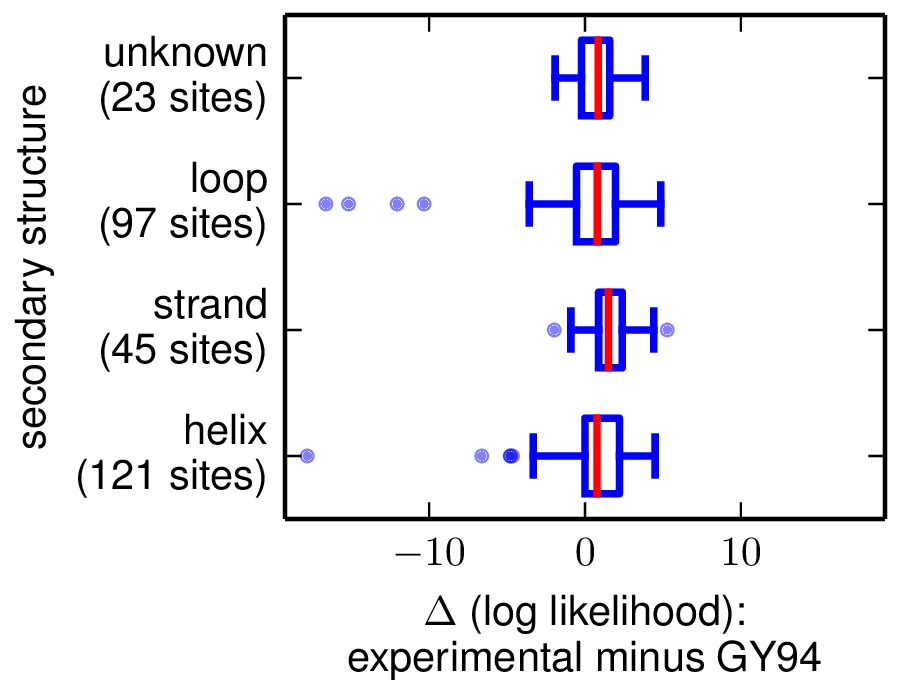
Example of the sitelikelihoodcomparison_bySS.pdf plot.